Updated on May 17th 2020, written by Dr David Owens.
To understand the risk of catching COVID-19 we need to understand the epidemic.
The Epidemic
In a previous article we explained the principles of the public health measures.
In any infectious virus the following factors influence the size of the epidemic:
- Mode of Spread
- Incubation Period
- Infectivity in the Incubation
- Individual and Population Immunity
These factors ultimately lead to a basic reproduction number R0 for each illness. This number is a measure of on average how many people are infected by an individual with the specific disease. If this number is <1 the epidemic will die (this means that on average each infected person infects slightly less than one other person). If this number is >1 the epidemic is likely to grow. Infections with higher R0 values are more likely to spread. Population measures such as isolation of infected individuals, masks, hand washing, school closures and social distancing all work by reducing the exposure risk with the intention of reducing the effective R0 below 1 but regardless as much as possible in order to give the best possible chance for the epidemic to die. We now have good evidence that public health controls based on the principles of social distancing can reduce R0 and control epidemic spread. The balance between the costs and benefits of public health controls will be key in controlling the epidemic. Hong Kong University measures the effective R0 in Hong Kong. It is available here1. This is a good measure of the impact of the current public health measures in Hong Kong in real time.
Understanding epidemics is maths and data. Try to look at the change in cases rather than cumulative cases. The number of cases and the number of deaths will get bigger every day. It is the rate of change which tells us whether the epidemic is getting bigger or smaller. Epidemic curves are useful to get a sense of where the fires are burning and most importantly whether that intensity is increasing or reducing as this will determine risk. It is important to realise that even within countries, we are not dealing with one big fire, but lots of little clusters which may be very distinct in the risk that they pose. Remember too that death is a lagging indicator. People must first get sick, they are then usually diagnosed and either recover or in some cases die. In the first series the mortality was 10-12 days post diagnosis. This may reasonably expected to be delayed with greater awareness and understanding of treatments so look for the mortality curve to lag the new cases by a number of weeks.
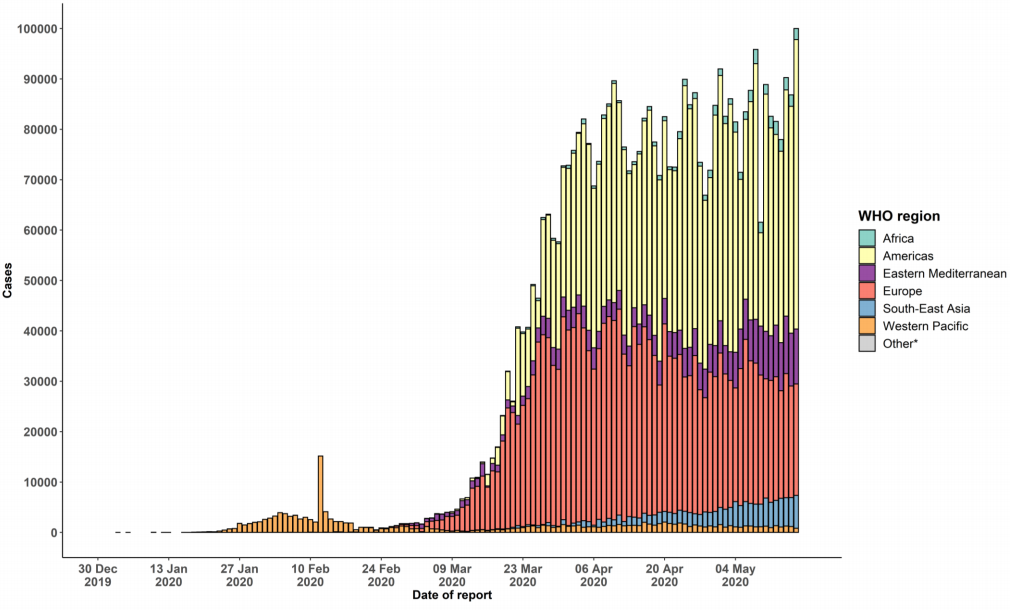
Figure 1 - Epidemic curve of confirmed COVID-19, by date of report and WHO region through 17 May 20202.

Figure 2 - Daily number of newly confirmed cases reported in Mainland China since January 10, 2020. Including the case revision on April 17, 2020.
Figure 3 is the latest data from the epidemic curve for Guangdong1.

Figure 3 - Daily number of confirmed cases reported in Guangdong Province since Janaury 10, 2020.
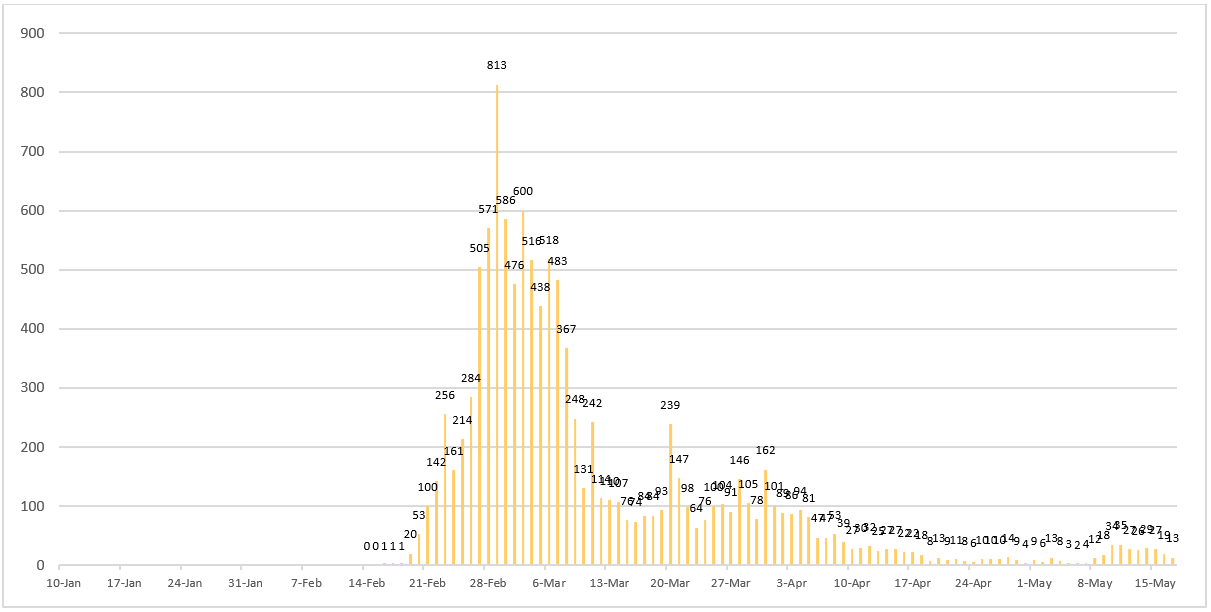
Figure 4 - Daily number of newly confirmed cases reported in Korea since January 10, 2020.

Figure 5 - Daily number of newly confirmed cases reported in Japan since January 10, 2020.

Figure 6 - Daily number of newly confirmed cases reported in Italy since January 10, 2020.

Figure 7 - Daily number of newly confirmed cases reported in Iran since January 10, 2020.

Figure 8 - Daily number of newly confirmed cases reported in France since January 10, 2020.
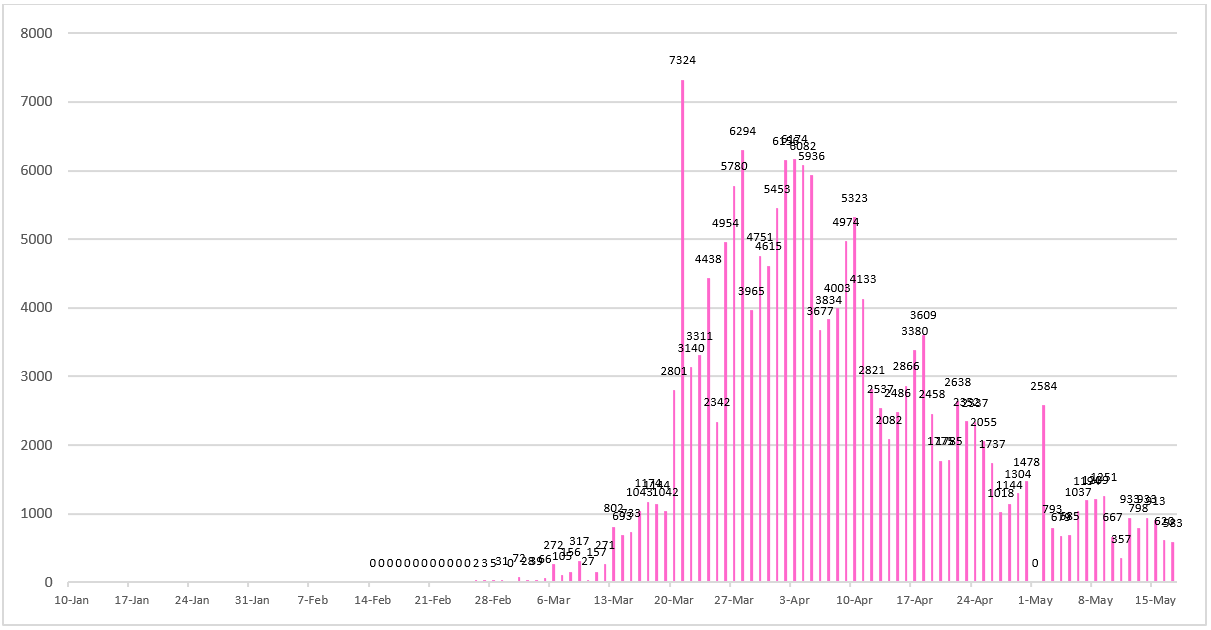
Figure 9 - Daily number of newly confirmed cases reported in Germany since January 10, 2020.
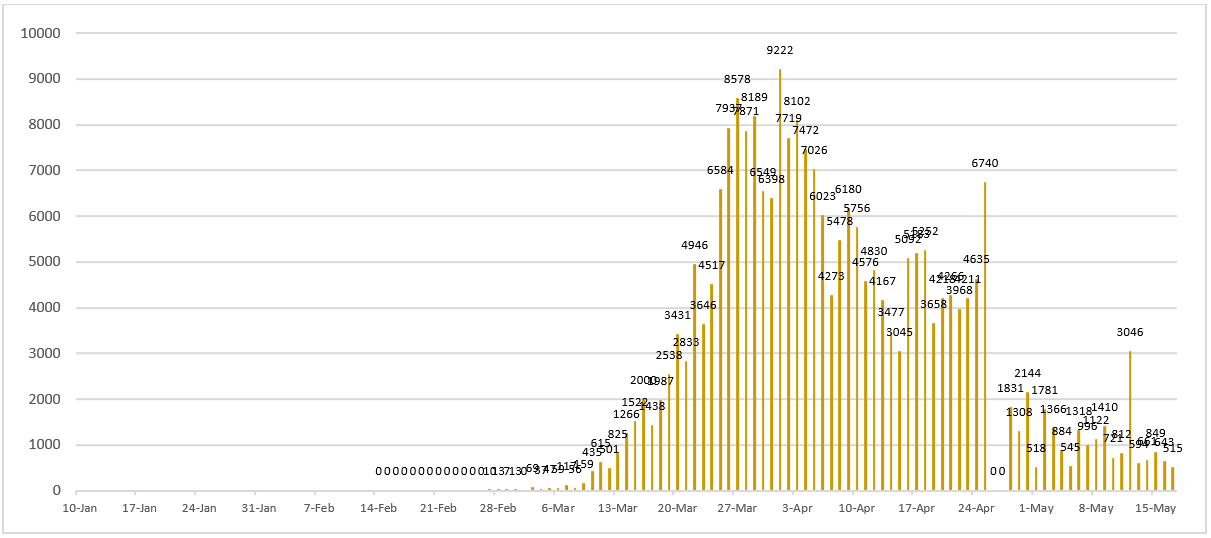
Figure 10 - Daily number of newly confirmed cases reported in Spain since January 10, 2020. As of April 26, 2020, Spain has revised its cases to only PCR-positive cases, reducing their numbers by 12,130.
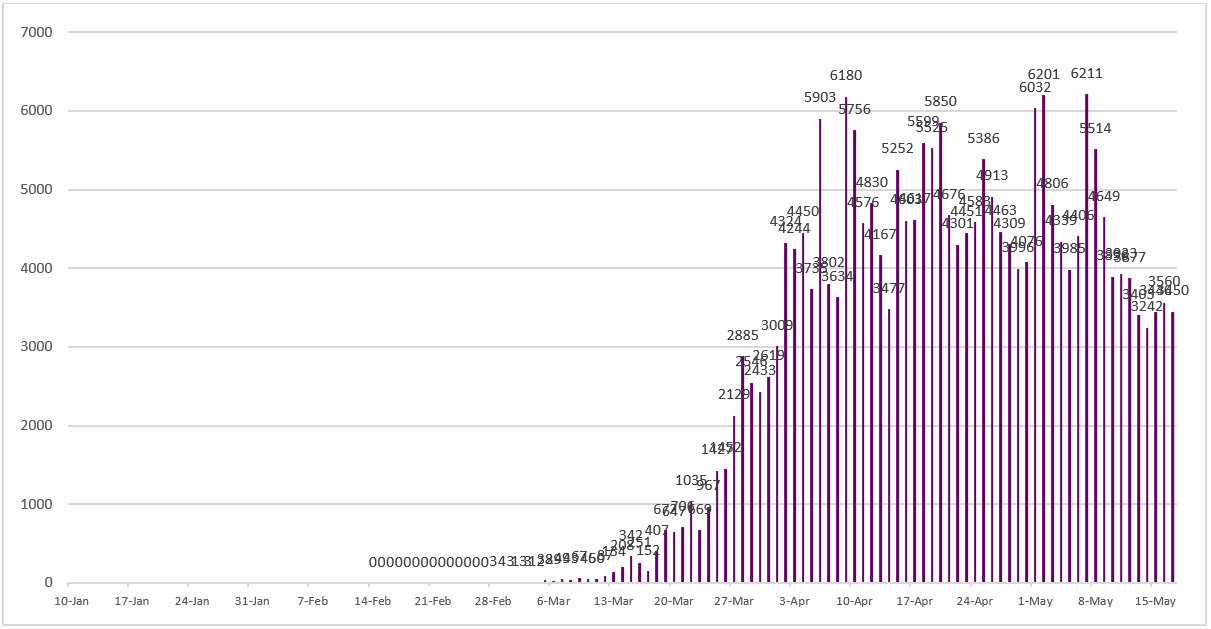
Figure 11 - Daily number of newly confirmed cases reported in United Kingdom since January 10, 2020.
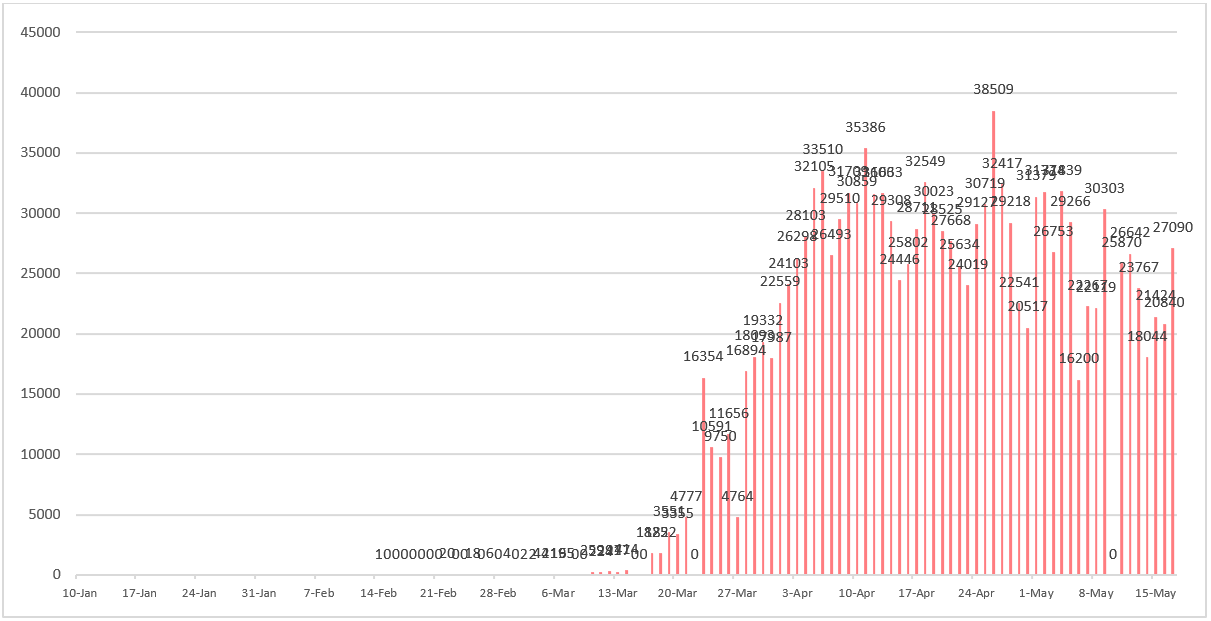
Figure 12 - Daily number of newly confirmed cases reported in United States since January 10, 2020. As of May 10, 2020, United States changed their standards of diagnosing COVID-19 and their cases were adjusted to 1,245,775.
Ultimately the impact of this disease on the population will be driven by the evolution of the epidemic. Excessive focus on the disease has the potential to distort real risk and significantly increase anxiety for the reasons previously discussed.
Information and education are key factors in the management of infectious disease. We have discussed the importance of having an anchor against which to measure risk. We have chosen influenza as a known entity against which to compare risks. COVID-19 is not a type of influenza and we are certainly not down playing its importance. Currently this disease seems to be more severe. Until we know the number of mild cases we cannot be certain about the relative severity on a case by case basis. Influenza has an infection fatality rate of approximately 0.1%. The crude fatality rate of COVID-19 in Hong Kong is currently 0.39%.
Influenza kills 650,000 people globally from respiratory disease. Although the numbers for COVID-19 are currently smaller they are accelerating. Whether COVID-19 has a greater or lesser disease burden than influenza will be determined by the ultimate size of the epidemic. This will depend in large part on the success of the public health interventions and comparison will only be possible in retrospect. Look at the changing numbers rather than cumulative COVID-19 numbers in isolation in order to get a sense of changing risk.
To learn more about the differentiation between a disease and an epidemic, click here.
References
1. Real-time dashboard. (n.d.). Retrieved from https://covid19.sph.hku.hk/
2. World Health Organization. Novel Coronavirus (2019-nCoV) situation reports. Retrieved from https://www.who.int/emergencies/diseases/novel-coronavirus-2019/situation-reports
 Central General Practice
 Repulse Bay
 Clearwater Bay
 BodyWorX Clinic
 Central Specialist Clinic
 MindWorX Clinic
 Partner Clinics
 Family Clinic
 OT&P Annerley Midwives Clinic

.png?width=1170&name=image%20(2).png)


